Usage
Calculating Land Use Mix (LUM) within a Specified Area
The landusemix package allows you to calculate Land Use Mix (LUM) within a specified area, such as a fishnet grid cell or any other geo-referenced area. The process involves calculating the areas of each specific land use type within the specified area and providing these areas to the core functions of the package to calculate LUM using two different indices: the Entropy Index and the Herfindahl-Hirschman Index (HHI).
Steps to Calculate LUM:
Define the Specified Area: This could be a fishnet grid cell or any other geo-referenced area.
Calculate Areas of Each Land Use Type: Determine the area (in square meters) of each land use type within the specified area.
Provide Areas to the Package: Use the calculated areas as input to the LandUseMixIndices class.
Calculate Indices: Use the entropy_index and herfindahl_hirschman_index methods to calculate the LUM.
Example:
from landusemix import LandUseMixIndices  # Updated import statement
from landusemix.utils import *

# Read areas from the shapefiles.
res_shp = 'landusemix/data/shapefiles/residential.shp'
com_shp = 'landusemix/data/shapefiles/commercial.shp'
ind_shp = 'landusemix/data/shapefiles/industrial.shp'

# Calculate the areas of each land use type
res_gdf = load_shapefile(res_shp)
com_gdf = load_shapefile(com_shp)
ind_gdf = load_shapefile(ind_shp)
res_area = res_gdf.geometry.area.sum()
com_area = com_gdf.geometry.area.sum()
ind_area = ind_gdf.geometry.area.sum()


# Example land use areas (in square meters)
land_use_areas = {
    'residential': res_area,
    'commercial': com_area,
    'industrial': ind_area,
}

# Create an instance of the LandUseMixIndices class
mix_indices = LandUseMixIndices(land_use_areas)

# Calculate the entropy index
entropy = mix_indices.entropy_index()
print(f"Entropy Index: {entropy}")

# Calculate the Herfindahl-Hirschman Index (HHI)
hhi = mix_indices.herfindahl_hirschman_index()
print(f"Herfindahl-Hirschman Index: {hhi}")
# Output:
# Entropy Index: 0.5986122886681098
# Herfindahl-Hirschman Index: 0.3333333333333333
Display Raster
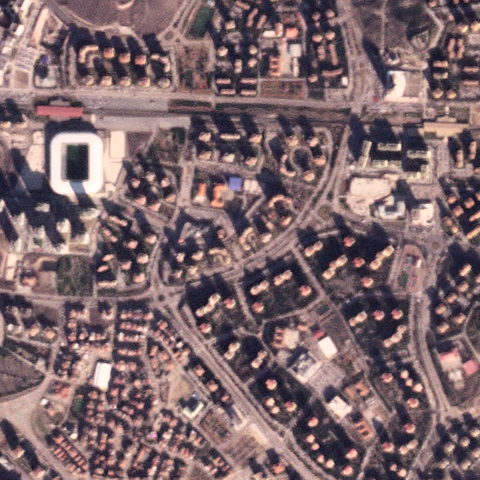
If you want to display the input raster data, the following code snippet demonstrates how to display a raster image using the rasterio package.
import rasterio
import matplotlib.pyplot as plt

# Open the raster file
with rasterio.open('raster.tiff') as src:
    # Read the raster image
    raster_image = src.read(1)

    # Display the raster image
    plt.imshow(raster_image, cmap='viridis')
    plt.colorbar()
    plt.show()
# Output:
# Display the raster image in a matplotlib plot.
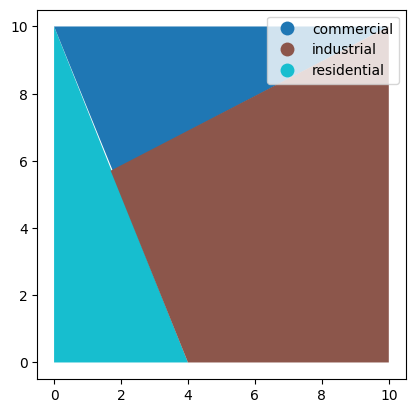
Display Shapefile
If you want to display the input raster data, the following code snippet demonstrates how to display a shapefile using the geopandas package.
import geopandas as gpd
import matplotlib.pyplot as plt

# Read the shapefile
gdf = gpd.read_file('landusemix/data/shapefiles/multiple.shp')

# Display the shapefile using matplotlib with different colors for each land use
fig, ax = plt.subplots()
gdf.plot(column='use', ax=ax, legend=True)
plt.show()
Display Results
Below is an example of how to visualize the calculated indices using the matplotlib package.
import matplotlib.pyplot as plt
import geopandas as gpd

# Assuming 'results' is a GeoDataFrame with calculated indices
results.plot(column='Entropy_Index', legend=True, cmap='viridis')
plt.title('Entropy Index Visualization')
plt.show()

results.plot(column='HHI', legend=True, cmap='plasma')
plt.title('Herfindahl-Hirschman Index Visualization')
plt.show()